Hi guys! In class we are currently learning how to graph
in our circular functions unit. I will be talking about how to graph sine
functions. When graphing on a Cartesian plane it is known as “unrolling” the
Unit Circle.
The general form for sine is:
y = a sin b(x
– c) + d
In order to graph a sine or cosine function you must determine the period and amplitude.
PERIOD is the length of one cycle that can either be in degrees or radians. The period for sinx or cosx functions can be found with the formula 2π / |b|
AMPLITUDE is the distance from the middle axis to the highest or lowest point for a sinx or cosx function. Amplitude can be found by taking the absolute value of "a"


AMPLITUDE is the distance from the middle axis to the highest or lowest point for a sinx or cosx function. Amplitude can be found by taking the absolute value of "a"
Amplitude = |a| or Amplitude = max-min / 2

Now that you have a better understanding of what period and amplitude is lets try an example:
Sketch the graph of y = 2sin2x for 0 ≤ x ≤ π
1. First find the period by using the formula 2π / |b|

This means the length for one full cycle of y = 2sin2x is π
2. Now lets find the amplitude by taking the absolute value of "a"

3. You are now ready to graph the sine function! On a graph plot the period on the x-axis and the amplitude on the y-axis.
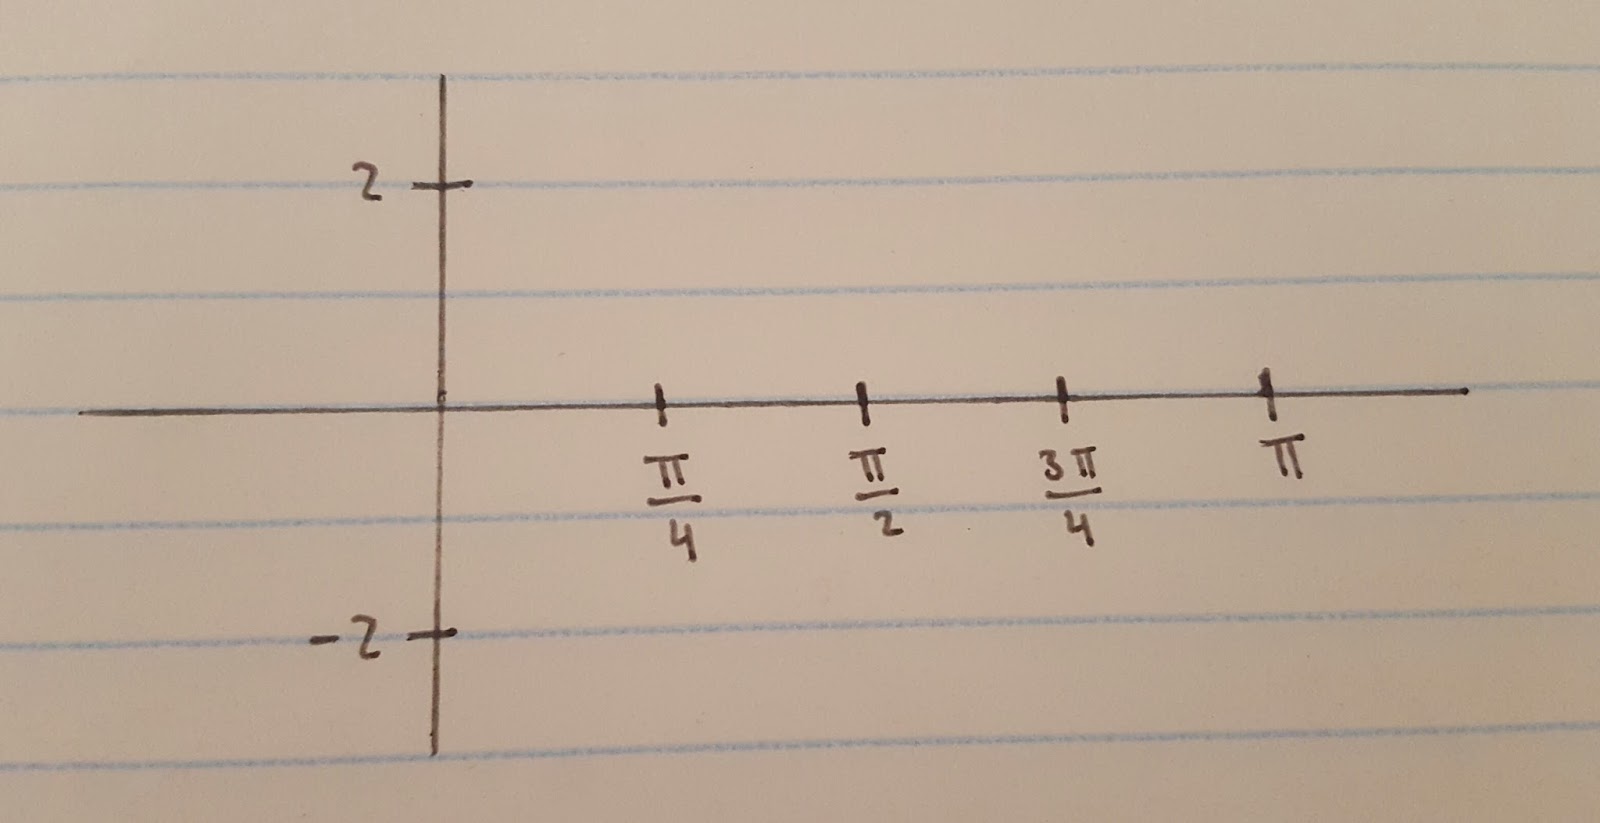
We split the period into 4 sections because of the 4 quadrants in the unit circle (remember we are "unrolling" the Unit Circle).
4. Since we are graphing a sine function plot your points starting from (0, 0). When graphing a cosine function you will start from (0, a). The given equation is positive therefore the next point will be in the positive side at (π/4, 2) The graph should look like a wave.

* Make sure to check for restrictions*
In this example the restrictions are 0 ≤ x ≤ π since our graph fits the restrictions it is complete!
I hope my example did not confuse you but instead helped you better understand how to graph a sine
function. Thank you for reading!
No comments:
Post a Comment